
Abstract: The author, herein, reports on the differences in sodium and potassium intake and blood pressure in the inhabitants of Papua New Guinea and northeastern Japan. The changes in salt intake and blood pressure in individual subjects were shown in longitudinal epidemiological studies over a period of 20 years. The salt intake of a group of 26 farmers decreased from 17.0 g/day in 1961 to 11.9 g in 1981: the blood pressure did not rise with advancing age.
ü@
Introduction
Tranditionally, the inhabitants of northeastern Japan consume 20-30 g salt/day(3). In 1960, Dahl(1) reviewed evidence that salt ingestion may be related to hypertension and, in addition, reported epidemiological finding in human hypertension. From observations in northeastern Japan, Sasaki(6) suggested that interaction between genetic and environmental factors is important in the causation of human hypertension.
ü@
Salt Intakes and Blood Pressure from a Global Viewpoint.
ü@
As a working hypothesis for the differences in blood pressure in a given population, the author proposed(4) the existence of a relationship between daily salt intake and the level and distribution of blood pressure. Sasaki et al.(7) found that the sodium content of the hair of persons living in Akita, whose salt intake was in execess of 20 g/day, was significantly greater than that of the hair of Papuans, whose salt intakes was assumedü@to be very low.
In 1981, Takemori(8) estimated the salt intake of the inhabitants of Papua New Guinea by using a filter paper absorption method(FPM) for collecting and transporting urine samples.
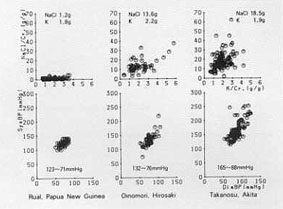 .
.Figure 1 shows results obtaines in Papua New Guinea in comparion with results obtained for inhabitants of Akita and Hirosaki areas in 1956(2). These cross-sectinal epidemiological findings seemed to be a clue showing a relationship between daily salt intake and the level and distribution of blood pressure of a given population. The findings in Hirosaki area, i.e., an apple-producing region in northeastern Japan, suggested a relationship between potassium intake, salt intake and high blood presssure(3).
ü@
Changes in Salt Intake and Blood Pressure
ü@
We have tried to assess the changes in salt intake and blood pressure in individual subjects in longitudinal epidemiological studies. In our epidemiological studies on hypertension in northeastern Japan, the author has made many observations on the area population by means of local mass surveys from 1954 up to the present(6). Blood pressure was measured by using a mercury sphygmomanometer with a 13-cm wide cuff, while the subjects was measured was in supine position. Blood pressure was measured several times; the lowest was recorded when different readings were obtained. The diastolic blood pressure was taken as the point at which the Korotokov sounds disappereared(phses 5). The average blood pressure level for each person was calculated according to the recording to the record obtained during the entire periods. The birth cohorts of 760 males and 899 females, 40-69 years of age, in the northeastern part of Japan were followed by checking in subsequent years(up to 1975). According to the results obtained at every 10 mmHg levelü@of blood pressure, it became obvious that those individuals whose blood pressure were aroud 120 mmHg for the systolic, and around 70 mmHg for the diastolic, were lowest in the death rates(5).
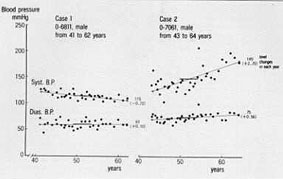
Figure 2 showes two examples of individual blood pressure levels, and the changes of blood pressure were 20 years. The changes of blood pressure were graphed according to the data calculated by regression analysis.
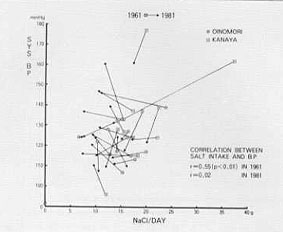
In 1961, volunteers were chosen from the farming people in Oinomori and Kanaya villages, in the northeast. The average age of both male and female participants was 46. Three concecutive 24-hour urine samples were collectted. In 1981, during the same month(February), we collected three consecutive urine samples of the same 26 farmers out of 40 asü@in 1961. Their blood pressure were measured once or twiceü@a year by mass survey from 1954 in Oinomori and from 1958 in Kanaya, respectively, up to 1975, and the changes in blood pressure for each person were calculated from the data obtained during the entired period. The results obtained are shown in table 1. The saltü@intake of these farming people decreased from 17.0 g/day in 1961 to 11.9 g in 1981; their blood pressure did not rise with advancing age. A positiveü@correlation(relationship)berween salt intake and blood pressure level in the farmers in northeast Japan was shown in 1961, but the coefficient of correlation between the salt intake and blood pressure level of the farmers in 1981, was not, however, statistically significant(fig.3).
Subject n NaCl g/day K g/day Na/K mEq/mEq Syst.BP mmHg Diast.BP mmHg
O-village 13 15.5ü©11.3** 1.8ü©1.7 6.1ü©4.7** 122ü©121 68ü©72
K-village 13 18.6ü©12.6** 2.1ü©1.5** 6.5ü©6.3 133ü©131 77ü©77
Total ü@ü@26 17.0ü©11.9*** 1.9ü©1.6** 6.3ü©5.5* 127ü©126 73ü©75
Middle-aged farmers (from 46 to 66 years on average)
Three consecutive 24-hour urine samples were collective from the same person in 1961 and 1981.
Longitudinal blood pressure neasurements were made once or twice a year by mass survey and the changes in blood pressure for each person were calculated according to the recprds obtained during the entired period.
*püā0.05, **püā0.01, ***püā0.001. Student's paired t test comparing the data in 1961 with 1981.
ü@
Apport de Na et de K dans la nourriture des Japonais
ü@
L'auteur rapporte les differences entre les habitants de Papouasie-Nouvelle-Guinee et les habitants du Nord-Estü@du Japon quant a leur consommation de sodium et de potassium et leur tension arterielle. Les changements intervenus dans la consommation de sel et dans la pression arterielle ontü@ete mis en evidence dans des etudes epidemiologiques longitudinales portant sur une periode de 20 ans. La consommation de d'un grupe du 26 agriculteurs a passe de 17 g/jour en 1961 a 11.9 g/jour en 1981: la pression arteriell n'a pas augment avec l'age.
ü@
References
ü@
1. Dahl.L.K.: Possible role of salt intake in the development of essential hypertension. In Bock, Cottier, Essential Hypertension, pp.53-65(Springer, Berlin,1960)
2. Sasaki, N.: Relation of urinary findings, especially sodium potassium ratio, to blood pressure level in farmers in the northeast of Japan. Med. Biol., 39, 182-187, (1956)
4. Sasaki, N.: in Hatano,Shigematsu, Strasser. Hypertension and stroke control in the community. pp.106-107(WHO,Geneva,1976)
5. Sasaki, N.: Prospective epidemiological studies on relation between blood pressure level and death from cerebrovascular diseases in populatuon. Hirosaki med. J. 31: 739-804(1980)
7. Sasaki, N.; Takemori, K.; Ohtsuka, R.;Suzuki, T.; Mineral contents in hair from Orimono Papuans and Akita dwellers. Ecol. Fd. Nutr. 11;117-120(1981)
8. Takemori, K.: Collection and transport of urine samples by filter paper absorption method.: the method of the determination of sodium, potassium and creatinine concentration in urine. Jap. J. Hyg. 35:721-727(1980)
ü@