In the northeastern region of Japan, there is an expression ' attata,' which literally means 'was being affected by'. This is an old expression and the exact meaning of the word is unclear, but it seems to be 'apoplexy,' which has been observed since the ancient Greek era. It occurs suddenly and the patient loses consciousness, resulting in motor paralysis. This is the so-called knocked-down condition that the people in the region call 'atari.' From its general symptomes, it can be differentiated from heart disease.
With regard to the diseases of the circulatory system in Japan, especially cerebrovascular disease, it is well known that the prevalence and the incidence differ in companion with other countries. The mortality rate from cerebrovascular disease, particulary in Northeast Japan, is high, even in the young and in middle-aged subjects below the age of 60 years. The cause of death is mainly cerebral hemorrhage, and seasonal differences exists: it occurs more often in winter than in summer.
We started epidemiological studies on stroke and hypertension in Japan, especially in the inhabitants of the Northeast Japan in 1954. Takahashi et al.(1) reported that the geographic distribution of cerebral apoplexy and hypertension in Japan could possibly be partly explained by the differences in atmospheric temperature. Cerebral apoplexy and hypertension were equally frequent in farm villages in which there was a surplus intake and rice and salt, and a lack of vegetables.
As an explanation of the nationwide regional difference in the mortality from cerebral apoplexy and in the blood pressure levels of the inhabitants, the author reported that the quantity of salt intake is the most influential factor from the standpoint of retrospective epidemiological studies(2).
1. BLOOD PRESSURE OF THE JAPANESE FROM A GLOBAL VIEWPOINT
Epidemiological studies on hypertension should be based on observations of blood pressure measurements in a specific population group. For this purpose, it should be known what level of blood pressure exists in different geographic regions in the world. There is still, however, a lack of coherent data in this field. Few international epidemiological studies on hypertension have focused on blood pressure, and not all methodological problems concerning blood pressure measurement are yet solved(3).
We could possibly get some clues from the data reported up to now. Figure 1 shows the correlation between the mean values and standard deviations of syatolic blood pressure in 50-year-old men.
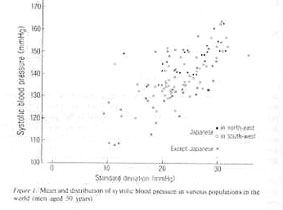
These values were selected from various population groups reported from many countries in the world. The literature cited here consists of 211 papers dealing with the epidemiology of blood pressure of Japanese before 1970, and with 86 papers published in foreign countries before 1969(4). It appears from this figure that these seems to be a difference in blood pressure level and distribution between each population group, even of they are the same age. Concerning the Japanese, especially the inhabitants of the Northeast, the measured blood pressure level seems to be high and has a wide range of Figuredistribution. In almost all Japanese groups, the blood pressure level increased with age: and in the group of young people with high blood pressure, the blood pressure level increased more rapidly at advanced age.
The author reported: 'For the investigation of blood pressure of a person, one must at first make mass surveys of levels and distributions of blood pressure of the population in which the person lives and compare to the level of his own blood pressure'(5).
We have proceeded in our study mainly from the standpoint of cause analysis concerning the difference in blood pressure levels in various groups, and the differences in individual blood pressure. We have also examined the relationship of blood pressure and various living conditions. As working hypothesis for the differences in blood prerssure in a population, the author proposed the relationship between the daily salt intake and the levels and distributions of blood pressure(6).
The blood pressure of humans varies from a low level with a narrow range of distribution, remaining so throughout life (e.g. native of Brazil and New Guinea), to a high level with a wide distribution, begining with childhood and progressing with age to a higher level and wider distribution(e.g. the inhabitants of Northeast Japan). Dahl reported the evidence that salt ingestion may be related to hypertension, and the results of the epidemiological findings in human hypertension, including the data from Japan, in an international symposium on essential hypertension in 1960(7); he said that the frequency with which certain levels of blood pressure are found is more meaningful than the mean values of blood pressure by his subjective judgment(8).
In previous work, we have already shown the relationship between the mean levels of systolic blood pressure by age and sex in the various populations in which the salt intake of the subjects population was actually measured(9,10). The correlation between blood pressure(both level and distribution) and daily salt intake is striking. The blood pressure level appears to be high already in a younger age group in areas with a salt intake of more than 10g/day/person, with a subsequent increase of blood pressure with aging. In areas with a salt intake of less than 5 g, on the other hand, the blood pressure is low at a younger age and no increase is noted with advance in age.

Figure 2 shows the correlation between the mean systolic blood pressure of the population aged 50 years and the average daily salt intake in various parts of the world. The salt intake of the Japanese population is influenced by its traditional eating habits, and it is striking that, about 20 years ago, the Japanese population, especially the inhabitants of the of the Northeast, consumed 20-30 g of salt per day(2).
2. BLOOD PRESSURE OF THE JAPANESE POPULATION
It has been reported that the blood pressure of the applications for life insurance and the blood pressure of the Japanese from the data of the National Survey in Japan are nearly the same as those of Americans. According to the summary of the WHO meeting held in Tokyo in 1974, high blood pressure is a prevalent condition in most parts of the world, and prevalent condition in most parts of the world, and prevalence data presented from Japan did not appear to be essentially from those from other areas.
However, there seen to be marked regional differences in the blood pressure of the Japanese, as well as in the blood pressure levels of the inhabitants in the Northeast and to compare the author's own data with the results of other local studies, the author has made many observations on the arterial blood pressure of the populations in the area by means of local mass survey from 1954 to 1958(11).
Blood pressure was measured by using a mercury sphygmomanometer with a 13-cm-wide cuff, while the subject was in the supine position. Blood pressure was measured several times, and the lowest blood pressure was taken as the point at which the Korotkoff sounds disappeared(phase 5).
According to the results of mass observations on the blood pressure of the inhabitants of the Northeast, the blood pressure was higher amomg inhabitants of the region compared with other districts in all age groups. And the level and distribution of blood prerssure actually differ between the communities. The blood pressure levels measured in the colder season (below a mean temperature of 10 °C) were higher than those measured in the warmer season (above 10 °C), even though the room temperature was aound 20°C in both seasons.
In the first mass survey on blood pressure of the inhabitants of the Northeast, the authors measured with precision the seasonal variation in the blood pressure of the same 831 subjects (274 male and 557 female) in winter and summer during five consecutive years(12). The difference in the blood pressure in winter and summer was always found to be significant, irrespective of sex, age group, or location, during each of the five years. The differences between winter and summer were around 10 mmHg for systolic blood pressure on average. Generally speaking, there was an obvious elevation in the blood pressure in the blood pressure to be one of the causes of the seasonal variation in the number of deaths from cerebrovascular disease in Japan.
The authors made observations on the blood pressure of middle-school pupils (aged 12-15 years) in the Akita prefecture twice a year, in winter and summer, from 1957 to 1962, and repeated the blood pressure measurement in winter of 1967(13). According to the results (male n=29, female n=26), a statistically correlation was found between the systolic blood pressure level and the Probit value (an index represneting the position of individual in a population) of the blood pressure in middle-school age and in adulthood (aged 18-25 years)
In order to know whether there is a relation between the blood pressure of parents and their children, and between husband and wife, the authors calculated the correlation coefificients between the blood pressure in the same farm village of Akita prefecture, the measurement being conducted twice a year from winter 1957 to summer 1961. The correlation coefficient between the blood pressure of husband and wife by age for systolic and diastolic blood pressure were not significant. From these results, we concluded that the blood pressure level at middle age or older might have been influenced partially by genetic and enveromental factors at a certain stage of life, especially at an age earlier than marriage(14).
In the Aomori prefecture, the authors made observation on the blood pressure of schoolchildren:357 primary-school pupils (aged 6-11 years) from November to December 1971(15), and 220 middle-school pupils (aged 12-14 years) from November to December 1973(13), three times a day sequentially for three days by means of the ausculattory method with the subjects in the sitting position. Then, 28 subjects from a primary school and 36 subjects from a middle school were selected on the basis of a constant deviation from the average value, i.e., boys and girls who always had high blood pressure or who always had low blood pressure.
According to the results of blood pressure measurements that were carried out three times a day for 17 days for the primary-school pupils sequentially in the same subjects, it was found that the individual subjects distributed themselves in a mass according to their 'probit,' which was computed from their own and the average level and the standard deviation of blood pressure of the mass:in other words, some subjects always indicated somewhat high and some rather low level of blood pressure from an early age onward.
As a results of the study on urinary potassium and sodium for five days (16,17), no correlation was found between Na/K(mmol), NaCl/creatinine(g), and K/creatinine(g) in the casual mornig urine and the blood pressure levels. The results are shown in Table1.
Table 1. Casual morning urine electrolyte content in blood pressure groups
HPSP↑ HPSP↓ HMSB↑ HMSB↓ HMSG↑ HMSG↓
n 14 14 9 9 9 9
Na/K (mmol) 3.09±1.53 4.03±1.63 4.68±1.63 5.60±2.02 4.54±1.67 4.13±1.17
NaCl/creat (g) 13.6±5.5 17.3±5.97 10.8±3.30 10.9±2.86 12.2±4.88 12.2±3.74
KCl/creat (g) 3.16±0.76 3.29±0.71 1.87±0.64 1.56±0.77 2.10±0.56 2.28±0.82
HPSP↑ :hypertensive primary pupils
HPSP↓ :hypotensive primary pupils
HMSB↑:hypertensive middle-school boys
HMSB↓:hypotensive muddle-school boys
HMSG↑:hypertesive middle-school girls
HMSG↓:hypotensive middle-school girls
The results of these epidemiological studies suggested that the interaction between genetic and environmental factors plays an important part in the causation of human hypertension.
3 .LONG-TEAM OBSERVATIONS ON BLOOD PRESSURE OF THE INHABITANTS OF THE NORTHEAST
The author has reported the results of our longitudinal epidemiological studies on hypertension in three farm villages in Northeast Japan(18):Oinomori population, n=700, Kanaya population, n=1400, in the Aomori prefecture; and Nishime population, n=5000, in the Akita prefecture. Blood pressure was determined once or twice a year by mass surveys in 1954, 1958, and 1957, respectively, up to 1975. The levels and distributions of blood pressure by age and sex in three villages were different at the begining, as were the findings in the daily life of the inhabitants in the three villages. The differences in the blood pressure corresponded to the death rates from cerebrovascular diseases in middle-aged subjects in the three areas.
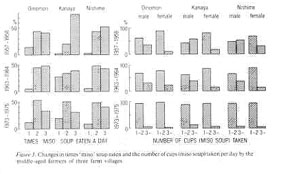
Intervention studies on the hypertension control by reducing high salt intake have been carried out in Nishime village since 1957 and Kanaya village since 1958. The level of blood pressure of the inhabitants of three villages tends to become lower compared with the level at the beginning, in the late 1950s, not only in middle-age group (Table 2) but also in a young-age group, such as middle-school children(10). We observed changes in dietary patterns such as haw frequently, or how many, bowls of 'miso' soup were consumed per day(Fig. 3). The average salt contents of 'miso' soup is 1.5%, and one bowl of Japanese 'miso' soup is usually 150-180 cubic centimater. On the other hand, no changes occured in the pattern of drinking 'sake' or in smoking. In the results obtained in field studies in December 1963, the urinary Na/K(mmol) ratios in the middle-age farmers in Oinomori, Kanaya, and Nishime villages were 6.45±3.28(n=43), 7.01±3.53(n=223), and 6.60±3.12(n=250), respectively. And the urinary Na/K ratio of the 206 middle-aged farmers in Nishime villages 5.47±2.68, according to the results obtained in the field studies in December 1970.
Table 2. Mean arterial blood pressure with standard deviation and frquency of persons with high blood pressure among the inhabitants of three farm villages in Northeast Japan by age and sex during 1954-1975.
Age(years) Number Systolic(mean,σ,%) Diastolic(mean, σ, %)
Oinomori, Aug.1954 male female
20-29 23 129.3 12.8 0 70.2 11.4 4.3 31 123.7 13.4 3.2 70.5 11.0 3.2
30-39 18 125.0 15.6 11.1 73.3 9.5 5.6 29 122.6 11.0 0 73.3 7.4 0
40-49 17 135.6 20.7 11.8 79.1 10.9 17.6 25 121.0 16.0 8.0 75.8 7.9 4.0
50-59 18 130.0 15.7 5.6 76.1 9.3 5.6 16 135.6 24.6 25.0 78.1 10.4 18.8
60-69 7 153.6 21.0 57.1 85.0 10.7 28.6 9 143.9 22.8 33.3 80.6 9.6 22.2
70-79 5 143.0 11.7 40.0 75.0 6.3 0 6 158.3 11.1 83.3 83.3 9.0 33.3
Oinomori Sep. 1974 male female
30-39 10 127.0 9.8 0 75.0 6.3 0 21 116.9 6.6 0 70.7 9.0 4.8
40-49 11 120.5 14.4 9.1 71.4 9.8 9.1 18 120.0 8.3 0 71.7 7.5 0
50-59 14 127.1 10.1 0 76.4 11.2 14.3 17 130.3 20.9 17.6 75.6 10.6 11.8
60-69 15 146.3 26.0 46.7 86.3 9.6 33.3 20 130.0 20.1 15.0 74.5 12.0 15.0
70-79 9 129.4 16.4 11.1 73.9 7.4 0 9 148.3 22.6 33.3 86.1 14.5 44.4
80-89 3 135.0 8.2 0 75.0 8.2 0 3 148.3 34.0 33.3 78.3 9.4 0
Kanaya, Aug. 1958 male female
30-39 18 132.8 14.0 56 73.3 13.0 22.2 21 130.2 12.6 9.5 73.1 11.8 9.5
40-49 55 141.2 28.1 29.1 80.8 14.6 18.2 68 135.1 24.4 19.1 80.7 13.7 22.1
50-59 42 144.3 23.3 33.3 84.1 13.7 33.3 38 145.5 24.8 39.5 83.4 12.6 21.1
60-69 24 149.2 19.8 50.0 80.0 10.0 16.7 38 155.5 31.0 55.3 84.7 16.4 34.2
70-79 17 167.9 33.7 64.7 89.7 12.4 41.2 15 191.0 30.5 93.3 93.0 13.3 66.7
Kanaya,Sep. 1974 male female
40-49 20 122.5 16.7 10.0 73.5 12.4 10.0 28 117.5 15.0 7.1 72.1 9.9 7.1
50-59 24 131.3 21.9 20.8 80.0 12.2 25.0 34 121.8 17.4 5.9 73.8 9.6 2.9
60-69 25 133.8 23.4 24.0 77.0 11.7 16.0 20 132.5 20.5 15.0 76.5 9.6 15.0
70-79 13 146.5 20.7 53.8 78.8 8.4 7.7 18 137.2 16.9 16.7 73.9 8.1 0
80-89 4 150.0 32.8 25.0 82.5 8.3 25.0 4 135.0 10.0 0 72.5 4.3 0
Nishime, June, 1958 male female
20-29 157 136.1 14.2 15.2 73.0 12.7 7.6 300 129.7 15.2 9.0 71.2 12.8 6.3
30-39 186 135.5 15.4 15.0 74.6 13.7 12.9 314 12.9.2 17.7 10.2 73.1 11.9 5.4
40-49 148 139.2 24.1 22.3 80.5 14.9 20.3 253 135.7 23.6 19.0 78.5 13.8 17.4
50-59 139 153.1 27.4 47.5 87.3 15.2 36.7 193 149.5 28.7 41.4 84.0 13.8 28.0
60-69 88 157.7 32.0 59.0 85.2 14.2 36.3 126 162.1 29.3 65.9 87.3 13.8 38.1
70-79 25 183.8 33.6 80.0 92.2 14.6 56.0 36 182.2 27.7 86.1 90.3 12.6 38.9
Nishime, Aug. 1975. male female
30-39 52 121.0 13.9 3.8 79.0 10.8 15.4 112 111.9 11.9 0 70.8 10.2 5.4
40-49 97 125.1 16.0 9.3 82.4 12.9 24.7 186 113.5 14.2 2.7 73.2 9.8 3.8
50-59 108 128.1 20.8 18.5 81.9 12.0 25.9 217 120.0 19.5 8.9 77.0 11.4 10.6
60-69 107 135.9 23.0 24.3 24.3 83.9 27.1 169 128.4 21.9 15.4 77.1 11.1 11.2
70-79 59 137.0 20.1 22.0 80.4 12.7 27.1 91 133.4 19.3 19.8 75.0 11.9 12.1
80-89 4 137.5 16.4 25.0 82.5 4.3 0 7 153.6 21.7 57.1 76.4 9.9 14.3
mean blood pressure in mmHg
σ standard deviation in mmHg
% incidence of persons in whom the blood pressure was 150 mmHg and above in systolic and 90 mmHg and above in diastolic
Data of the blood pressure measurements which were made once or twice a year during above-mentioned periods in three villages were from this table.
4. CONCLUSION
From the epidemiological viewpoint, the level and distribution pattern of the blood pressure of a population seems related to the daily salt intake, which is determined by dietary habits from childhood onward. Also, the results of epidemiological studies on the blood pressure of inhabitants in the Northeast suggested that interaction between genetic and enviromental factors is important in the causation of human hypertension.
According to the results of intervention studies on hypertension, control by reducing salt intake changed both the level and the frequency distribution of blood pressur, as well as the way of life for the inhabitants of Northeast Japan.
REFERENCES
1. Takahashi E. et al.: Human Biol., 29:139-166, 1957.
2. Sasaki, N.: Jpn. Heart J., 3:313-334, 1962
4. Sasaki, N. et al.:8th World Congress of Cardiol.,(Abstract), Sep. 1978, Tokyo, p340.
5. Sasaki, N.:Hirosaki Med. J.,14:331-349, 1963.
6. Hatanao, S. et al.(eds):Hypertension and control in the community, Geneva, WHO, 1976, pp 106-107.
7. Dahl, L.W.: Possible role of salt intake in the deveolment of essential hypertension. In Bock, K.D. Cottier, P.T.(eds):Essential hypertension. Berlin, Springer, 1960. pp 53-65.
8. Dahl, L.K.:Evidence for mineral character of atherosclerosis in hypertensive Japanese farm labors. At Bomb Causality Commis. Tech. Rep.16:37-38, 1959.
9. Sasaki, N.: The salt factor in hypertension(Abstract), 6th World Congress of Cardiology, London, Sep. 1970, p. 24.
10. Sasaki, N.:The salt factor in apoplexy and hypertension. In: Yamori et al.(eds)Proceedings of the international symposium on prophylactic approach to hypertentive diseases. New York, Raven, 1979. pp 467-474.
11. Sasaki, N.:Jpn.J. Public Health, 6:496-503, 1959.
12. Sasaki, N. et al.:Hirosaki Med. J., 21:202-211, 1969.
13. Sasaki, N. et al.: Hirosaki Med. J., 20:400-408, 1968.
14. Ishiyama, R.: Hirosaki Med. J., 17:607-615, 1966.
15. Sasaki, N. et al.:Jpn. J. School Health, 16:174-179, 16:338-342, 1974.
16. Nakamura, K.: Hirosaki Med. J., 30:603-630, 1978.
17. Sasaki, N. et al.:Jpn. J. School health, 16:488-189, 1974.
18. Sasaki, N.:Epidemiological studies on hypertesion in the northeastern parts Japan. In: Proceeding of the First Asian-Paific Symposium on Hypertesion, Tokyo, Jpn, Circ J. 41:1139-1142, 1977.