Various characteristics have been noted in fatal apoplexy in Japan. First, the mortality of cerebral apoplexy is higher in the north-eastern district except Hokkaido than in the south-western district. Second, the seasonal difference is apparant and it is lower in the summer than in the winter.
As to the first characterictic, we reported previously1) that regional difference in the mortality from apoplexy in Japan was parallel to regioanal difference in the level of blood pressure of the inhabitants. According to the results of mass observations on the blood pressure of the inhabitants of the north-eastern district2), the blood pressure was higher among inhabitants where the mortality from apoplexy was higher among inhabitants of any other districts from the young generation to the old one. The blood pressure measured during the colder season was higher than the measured during the winter season. The data are summarized in Table I.
Comparative investigations were made on mortalities classified by ages by vital statistics between Akita Prefecture showing the highest mortality from apoplexy among the north-easten distict where the mortality was generally high and Okayama Prefecture in the south-western district where the mortality was low (Fig.1).
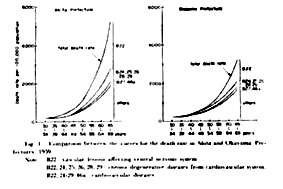
In Akita Prefecture , the mortality was high even in the fourth and fifth decades. Investigations of the further details by casuses of death revealed the following difference between the 2 prefectures. Difference in the mortality from B22 of the international classification of death casuses(vascular lessions affecting central nervous system)was most marked. Difference was hardly noted in the mortalities from the other diseases except those of the cardiovasular system which were related with B22. Thus the representative picture of regional difference in the mortality from apoplexy in Japan was shown. Since it is recognized that regional difference in the mortality from apoplexy and that in the level of blood pressure of the inhabitants are in a parallel relation, investigation of regional difference in the mortality is considered a clue to an elucidation of high blood pressure which is the primary cause for the death from apoplexy.
In the present paper , the subject of the salt intake of Japnese people which is considered to be the most important factor to influence regional difference in death from apoplexy in Japan is discussed.
Results of the nutritive investigation of farmers made in 1958 by the Ministry of Agriculture and Forestry were used as data to observe reginal difference in the nutritve intake in Japan3). This investigation was based on the basis values of the economic investigation of farm families. Food and drink taken by the families were classified by types, and the amounts of the consumption and the intake of nutritive elements from them were caluculated. A little less than 6,000 families all over Japan were the objects of the investigation, and the caluculation was made on the daily basis data for a year.
1) Relation with nutritive elements
Correlation was examined between a farmer's average intake of each nutritive element per day classified by prefectures and the mortality from apoplexy in the middle age(30-59 years). It was significant at less than 1% level of significance between the mortality and salt and fat The larger was the intake of salt or fat, the higher was the mortality. No significant correlation was noted between the mortality and the intake of calories, protein, calcium, vitamin A, vitamin B1, vitamin B2, or vitamin C(Table II).
2)Relation with types of food
Significant correlation at less than 1% level of significance was observed between the mortality and seasonings, the other vegetables and pickles, pulses, and the total of food. The larger was the intake, the higher was the mortality(Table III).
3)Relation with the salt intake
In order to investigate the relationship between the mortality and the net salt intake, the authors examined the salt intake from the data of nutritive investigation of farmers using the analysed values, weight-volume exchange rates and eatable rate. The correration with the mortality was investigated in salt in "seasining", in "miso", in "other vegetable and pickles" , in "soy-sauce", in "other foods", and "total salt". It was significant at less than 1% level of significance in salt in "miso","total salt", and "salt in other vegetables and pickles" and not significant in the others(Table IV).
The salt intake of the Japanese, especially of the inhabitants of the north-eastern district is perpaps the greatest in the world. According to nutritve investigation of farmers, an adult farmer of the north-eastern district takes 27Gm. a day, while one of the Kinki district takes 17Gm.4). Fukuda5) measured the excretion of Cl per day in the 24-hour urine among 293 farmers in Akita Prefecture, and found 26.3Gm. of salt per day on the average and 50Gm. at the maximum. Takamatsu6) reported that the salt excreation examined among 65 farmers in Akita Prefecture was 27.3Gm. on the average and 61.4Gm. at the maximum, and that measured among 59 farmers of Okayama Prefecture was only 15.4Gm. on the average and 25.9Gm. at the maximum. Suzuki et al.7) observed 27.3Gm. on the average and 41.4Gm. at the maximum of salt excretion in examination of 36 male farmers in Yamagata Prefecture, and 21.5Gm. on the average and 30.6Gm.at the maximum in that of 40 female farmers in the same prefecture. Dahl8)observed 14Gm.of salt excretion among the inhabitants in Hiroshima. We9) collected urine of 38 men and women of middle age at an agriculture village in Akita Prefecture for minumum of 10 days and maximum of 22 days and measured Na by flame analysis and found 18.1Gm. on the average of salt a day, 30.4Gm. at the maximum and 12.0Gm. at the minimum.
In such district where the salt intake is large, the mortality from apoplexy and hypertension is often noted. Besides, as stated above, definite correlation is observed between regional difference in the salt intake and that in the mortality from apoplexy. Therefore, it is necessary to investigate why the salt intake of the Japanese is so large and why there should be such a difference in the salt intake.
The salt intake is perhaps frequently influenced by the long standing eating habits. Japanese people take salt mainly in the form of 1)soy-souce, 2)seasonings or table salt, 3)miso, 4)pickels and 5)other foods. Accdording to the survey, Japanese farmers takes 6.50Gm.of salt from soy-souce, 5.83Gm. of salt from seasoning, 3.14Gm. of salt from miso, 2.53Gm. from the other vegetables and pickels, and 1.21Gm. of salt from other food per capita per day respectively, and the total sum of the salt intakes is 19.21Gm. on the average.
According to the Standard Tables of Food Composition in Japan , salt contained in soy-souce was 18Gm. per 100ml., but the results of our analysis of the materials sold in the north-eastern district10) showed 16.8-25.2Gm. with an average of 21.4Gm. However, no regional difference was observed in the salt aount contained in soy-sauce among various districts of Japan.
Miso is made from soy beans, yeast and salt, and classified into commercial miso made in factories and home-made miso. According to the analysis table, "sweet miso" contained 7% of salt and "salty miso" 12%, but the salt amount contaiend actually sold in varoius districts was 15.0% at the maximum , 4% at the minimum and 12.1% on the average, and the regional difference was marked. Generally, miso in the north-eastern district containd more salt, while that in the south-western district contained less, and a significant correlation was proved between regional difference in the salt amount in miso and that in the mortality from apoplexy11). As to home-made miso, the ratio of salt to soy beans and yeast differed with districts and homes, and generally the ratio was higher in the north-eastern district than the south-western district.
In the actual daily life, Japanese people take miso in miso soup at meals, and regional difference was noted in the salt concentration of miso soup12). A total of 3,758 kinds of miso soup were collected from 4 districts , Akita Prefecture in the north-eastern district and Ibaragi Prefecture where the mortality from apoplexy was high, Okayama Prefecture where the mortality was low, and Saga Prefecture where it was a little high , and were analyzed. Miso soup of Akita Prefecture contained 1.50% of salt, that of Ibaragi 1.63%, Okayama 1.44%, Saga 1.47%, and the average was 1.51%. As to a frequency of miso soup consumption, it was quite different with districts. In Akita Prefecture it was served 2.4 times a day, in Ibaragi 2.4 times, in Okayama 1.0 time ,and 1.2 times in Saga. Naturally there was a great individual variation in salt intake depending upon how many cups were taken at a time. A cup usually contained 150ml. to 200ml..
The difference of salt contained in pickles was not difinitely shown on the analysis table. According to the values used for calculation of nutritive investigation of farmers, "takuan"(pickled radish)contained 11.93Gm. of salt per 100Gm. and the other pickles contained 4.12Gm..However, a fairly marked regional deifference was considered in the salt contents in pickles since the pickling methods differed with tea between meals was noted.
In addition to miso and pickles, salted fish and preserved meals food contained much salt.
Thus, in Japan, the basic form of a meal is to eat rice with miso soup and pickles, and therefore the salt intake is consequently large.
The relationship between the so-called "essential hypertension" and metabolism of salt and water has called the world-wide attention. Also it has been proved that the mortality from apoplexy and the level of blood pressure in Japan are parallel with the salt intake of the inhabitants. In such subject , it is naturally necessary to investigate factors which are considered to give influences to sodium metabolism. For instance, aldosterone, a hormone which has a relation to the metabolism of salt and water, and other minerals have to be investigated.
We13)have been greatly interested in the fact that the mortality from apoplexy differs greatly between Akita and Aomori Prefecture which are neighboring each other, and making investigations on the relation with apples which are raises greatly (70% of the total production of this country)in Aomori Prefecture especially around the Hirosaki area where our university is located. The difference in the mortality between the 2 prefectures is shown in Table V.
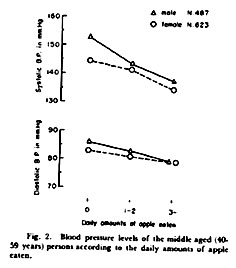
It is also interesting that mortality is lower at the apple producing zone even in the same Nakatsugaru area of Aomori Prefecture. The large difference in the living conditions of the inhabitants between these 2 prefecture is related with apple raising. Naturally, the inhabitants of Aomori Prefecture eat much more apples than that of Akita Prefectire. Blood pressure of Aomori inhabitants is lower than that of Akita inhabitants. Mass examinations of blood pressure were made in the inhabitants of Aomori district, and the results of 1,110 middle aged persons were classified according to the daily amounts of apple intake. As shown in Fig.2, blood pressure was lower in those eat more apples.
Blood pressure of 38 middle aged men and women of an agricultural village in Akita Prefectire was measured everyday for a month9). After the second week, the blood presuure decreased signignificantly in 18 of them in whom an average of 6 apples were given a day in consumption to them who did not eat apple. Measurement of K and Na in urine in those 2 groups proved that the Na/K ratio decreased after eating apples.
In order to make a comparative investigation on the balance between Na and K in the daily life among varoiu regions in Japan, the urine of the middle aged farmers of the following 4 regions was collected for 3 consecutive days, Na and K were estimated by flame analysis; A)20 inhabitants of Oinomori,Hirosaki City,Aomori Prefecture(apple-rice field zone), B)20 inhabitants of Kanaya, Onoe Town, Aomori Prefecture(rice field-apple zone), C)30 inhabitants of Kamosaki, Sanyo Town, Okayama Prefecture(rice and wheat field zone), and D)32 inhabitants of Ota,Takanosu Town , Akita Prefecture(rice field zone). The results were as shown in Table VI, and significant correlation was noted between blood pressure and Na/K ratio in their urine.
Cardiovascular diseases among Japanese people have an internationally specific pattern. While the mortality from cardiac diseases is comparatively low, that from vasucular damage of the central nervous system is high. The Committe on Visceral Circulation in Japan14), revealed that the incidence of cerebral, cardiac and renal involvements as direct causes of death in essential hypertension including malignant autopsied cases, but the order of these incidences were the same, both in autopsied cases and clinically diagnosed cases. It has been known that the intake of fat by Japanese is little, and atherosclerosis is comparatively less often observed among Japanese people than in western individuals. It is also known that there are faily many hemiplegic patients resulting from apoplexy. From these facts various investigators have suggested some peculiarity in the death of Japanese patients from apoplexy. These changes of the death pattern are also different among Japanese who immigrate from Japan to Hawaii and America15).
As stated above, there are various characteristics in the mortaliy from apolexy in Japan. Among them, the regional difference is considerd to be a good clue to the epidemiological study of this disease. Through studies of death from cerebral apoplexy in Akita Prefecture showing the highest death rate in Japan, the following researchers have expressed their opinion as to the probable causative elements. Kondo and Kato16)observed the tendency in the local inhabitants toward unbalanced diet consisting of polished rice and pointed out deficiencies in the dietary life. Nakazawa17) mentioned gluttony over rice , excessive intake of salt, cold temperature, heredity as predispositions to multiple occurance of cerebral apoplexy. Fukuda5)cited as the elements the integrated life stress such as overwork of farmers, excessive intake of salt, and deficiency of vitamin C in the diet. There are a scancy of researchers in which factors for the explication of the nation-wide reginal difference have been stated, but Misawa18)paid attension to the quantity of silicic acid contained in drinking water and food, Kobayashi19)emphasized that the SO4/CO3 ratio of river water is positive correlaton with the death rate from cerebral apoplexy and Ueno20)is in pursuit of the relationship with soil. Scroeder21)pointed out correlation with the distribution of cadmium in the intestines of a widely eaten river fish of Japan. Besides these studies of various viewpoints such as climates1), blood groups22), and the living standards23), it is important to elucidate this regional difference.
However, correlations between regional difference in the mortality from apoplexy and those are more obscure than the correlation between the mortality and the salt intake in dietary life of which we have reported. The large salt intake of Japanese people is internationally conspicious and it has been clarified that this peculiarity is due to the long standing dietary habit in Japan.
Consideration should be given to the factors giving influences to salt metabolism. Investigations have been made on the action of K on Na since Bunge's classic experimant24) based on the fact that grass-eating animals want Na, while flesh-eating animals do not require the salt.
Recently, a inhibitory action of K on the harm of Na has been assumed by animal experiments25). Isn't there a relation between the fact that the level of the blood pressure and the mortality from apoplexy are low in the apple raising region and the lowness of Na/K ratio due to the K intake from apple in the daily dietary life? This seems to be an interesting question.
Investiations were made on the relation betwen reginal diffence in the mortality from apoplexy, a charactaristic of Japanese death from this disease and the dietary life, and the following results were obtained.
1) Salt was named first as a nutritive element relating to the reginal difference. It was found that reginal difference in the salt intake was marked, and large aounts (more than 20Gm.)of salt were taken in the north-eastern district where the mortality from apoplexy and the level of blood pressure of the inhabitants were high.
2) It was clarified that the Japanese salt intake was influenced by the Japanese dietary habit to eat rice with miso soup and pickles and to use soy-sauce as a seasoning. Regional difference in the salt intake was due to regional diffrence in salt contained in miso and pickels.
3) Investigations were made on the relation with K, a factor to give influences to the relation between high blood pressure and the salt intake. The fact that the mortality from apoplexy and blood pressure were comparatively low in the apple producing regions of Aomori Prefecture, though it was also in the north-eastern district, suggesting that eating apples containing abundant K had something to do with this phenomenenon and the author emphasized the necessity to give consideration to balance between Na nad K in the daily dieatry life.
1. Takahashi, E. Sasaki, N.,Takeda, J.,and Ito, H.:Human Biology 29:139,1957.
2. Sasaki, N.:Nippon Koshu Eisei Zashi(J.J.P.H.) 6:496,1959(In Japanese)
3. Sasaki, N.,Takeda, J., Fukushi, S., Mitsuhashi,T., Hijikata, T., Fukushi, M., and Ishiyama, R.:Nipppon Koshu Eisei Zasshi(J.J.P.H.)7:1137, 1960(In Japanese)
4. Sasaki, N., Takeda, J., Fukushi, S., Mitsuhashi, T., Ukai, H., Saito, E., Ono, A., and Kawagishi,T.:Sogo-igaku(Medicine)15:101, 1958(In Japanese)
5. Fukuda, T.:Chiba Igaku-kai Zasshi(J.of Chiba Medical Society)29:490, 1953(In Japanese)
6. Takamatsu, M.:Rodokagaku(J.of Science of Labour)31:340, 1955(In Japanese)
7. Suzuki, S., Tezuka, T., Oshima, S., Kuga, T.,Yamakawa, K., and Nagamine, S.:Eiyo-gaku Zasshi(Japanese J. of Nutrition)17:159,1959(In Japanese)
8. Dahl, L. K.:Hypertension. The First Hahnemann Symposium on Hypertensive Disease, edited by J. H. Moyer., W. B. Saunders Company, Philadelphia and London, p.262,1959.
9. Mitsuhashi, T.:Hirosaki Igaku(Hirosaki Med.J.)12:57, 1960(In Japanese)
10. Fukushi, S., Kobayashi, M., and Ukai, H.:Hirosaki Igaku(Hirosaki Med.J.)11:53, 1960(In Japanese
11. Sasaki, N.:Igaku to Seibutsu-gaku (Medice and Biology)38:187, 1956(In Japanese)
12. Ukai, H.:Hirosaki Igaku(Hirosaki Med.J.)12:751, 1961(In Japanese)
13. Sasakii, N.,Takeda, J., Fukushi, S., Mitushashi, T., Hijikata,T., and Fukushi, M:Nippon Koushu Eisei Zasshi(J.J.P.H.)7:419, 1960(In Japanese)
14. Okinaka, S. et al.:Jap.Circulat.J.:23:385, 1959.
15. Gordon,T.:Pub.Health Rep.:72:385, 1957.
16.Kondo, K.and Kato,K.:Noikketsu (Cerebral Hemorrhage), edited by Nishino:Maruzen, p.63, 1950(In Japanese)
17. Nakazawa, F.:Nippon Naika-gaku Zasshi(J.J.S.I.M.)40:487, 1951(In Japanese)
18. Misawa, T.:Nihon Iji Shinpo(Japanese medical weekly periodical)1719:3, 1957(In Japanese)
19. Kobayashi, J.:Ber.Ohara Inst.Landwirtsch.Biol.11:12, 1957.
20. Ueno, S.:Yamaguchi Igaku(Yamaguchi, Med.J.)6:16, 1957(In Japanese)
21. Schroeder, H.A.:Essential Hypertension, edited by Bock and Cortier, Springer-Verlag, Berlin, p.84, 1960.
22. Yoshimi, M.:Minzoku Eisei(Race Hygiene)26:197, 1960(In Japanese)
23. Sasaki, N., Takeda, J., Fukushi, S., and Yamaguchi,T.:Igaku no Ayumi 35:178, 1960(In Japanese)
24. Bunge, G.:Z.Biol.9:104, 1873.
25. Meneely G. R.,Ball, C.O.T., and Youmans, J.B.:Ann.Int.Med.47:263, 1957.