It is epidemiologically interresting that the patterns of death differ with various races. The time when the predominant causes of death were contagious diseases has passed, and now the chronic diseases which develop with advanced age have become important. As such time, it seems especially important to investigate the habitual pattern of life of each race.
In Japan, too, deaths from contagious diseases such as tuberculosis decreased rapidly after World War II and chronic diseases such as apoplexy, cardiac diseses, and cancer have become the main causes of death. There is an epidemiologically interesting problem in the pattern of death of the Japanese. The first of the causes of death is apoplexy, and deaths from cardiac diseses are comparatively few. This is the reverse of the situation in Europe and America. Scholar who have opinion that atheroscrelosis, the basis of much adult cardiac, is closely related to fat intake refer to the fact that deaths from cardiac diseases are fewer in Japan as evidence for their theory. However, no definite explanation has been given for the fact that apoplexy is common in Japan. There seems to be an opinion among some that in Japan all of acute deaths of older people are apt to be attributed to apoplexy because the diagnostic techniques are poor, leading to the deaths shown in the vital statistics. Histopathological examinations, however, have revealed that that the order of apoplexy and cardiac diseases as causes of death in the same in autopsy series as in clinical diagnosis, and the mortality from apoplexy is still high.1) Actually, the death from apoplexy reflects a variety of processes. In Japan, it remains to be solved whether the death from apoplexy is due to the cerebral infarction, intracranical hemorrhage, or other diseases, but it is assumed that the death from apoplexy of the Japanese, especially in young adults, reflects hypertensive intracranial hemorrhage. This assumption is made bacause of the fact that severe atherosclerosis is rarely to be found and because of histopathological examinations and clinical pictures. Furthermore, recent investigations have brought out that there are fairely numerous persons suffering from hemiplegia, the aftereffect of an apoplectic attack. These facts suggest that the mortality from apoplexy is high in Japan.
Features of mortality from apoplexy.
Observations of mortality rates from apoplexy, the most dominant cause of death, have to revealed extreme regional differences in Japan. The authors previously investigated the regional differences in mortality from apoplexy in Japan.2) Comparative investigations were made on mortality classified by age between the Akita prefecture, showing the highest mortality from apoplexy in the northeastern district where the mortality was generally high and the Okayama prefecture in the southwestern district where the mortality was low(Fig.1, Table 1).
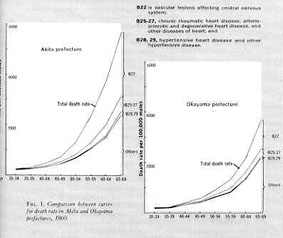
In the Akita prefecture, the mortality was high even in the fourth and fifth decades. Investigations of the further details by causes of death revealed the following difference between the 2 prefectures. Difference in the mortality from B22(vascular lesions affecting central nervous system)of the International Statiscal Classification of Diseases and Causes of Diseases and Causes of Death was most marked. Differences were hardly noted in the mortality from other diseases except those of the cardiovascular system which were related to B22. Thus, the representative picture of regional differences in the mortality from apoplexy in Japan was shown. This fact suggests that there is some factor leading people to early death and presenting a public health problem. Since it is recognized that regional differences in the mortality from apoplexy and in the level of blood pressure of the inhabitants are in a paralled relation, investigation of regional differences in the mortality is considered a clue to an elucidation high blood pressure which is the primary cause for death from apoplexy. It is epidemiologically important to reveal development to chronic disease in its early stage.
Blood pressues of the Japanese
It has been reported that the blood pressure of the applicants for life insurance and the blood pressure of the Japanese from the data of National Nutrition Survey in Japan are the nearly the same as those of Americans.3)
However, there seem to be marked regional differences in blood pressures of Japanese, as well as in the mortalities from apoplexy. The authors previously made comparative investigations on the results of measurement of blood pressures of various districts in Japan and reported the regional differences.2) Itahara and associates4) reported that the frequency of essential hypertension in 4 localities in Japan, taking persons over 20 years of age in active life in their respective home cities, increased as the north latitude increased. The authors made numerous mass measurement of blood pressure of the inhabitants of the northeastern district.3)
The results are summarized in Table 2.
The values of not only middle-aged and elderly adults but also younger persons are much higher than the general values of the Japanese for all Japan obtained from the data applicants for life insurance and National Nutrition Survey. Also, in the northeastern district, the blood pressure measured in the colder season below a mean temperature of 10゜C. were higher than those measured in the warmer season above 10゜C. In the fifth decade, those whose blood pressure were higher than 150mm.Hg in the systolic blood pressures and 90mm.Hg in the diastolic blood pressure were 32 to 38% in the warmer season and 39 to 59% in the colder season. There are the average values of the blood pressures of numerous inhabitants of the northeastern districts which the authors measured. Therefore, the levels of blood pressure actually differ with communities, the ratio of hypertensive persons in the fifth decade being less than 10% in one community while it was over 70% in another. The authors also observed that where the level of blood pressure of the inhabitants was high, the mortality from apoplexy was also high.
Factors related to regional differences
From the epidemiological viewpoint, the observation that there are regional differences in mortality from apoplexy and levels of blood pressures in Japan is considered to give a good clue to clarification of essential hypertension. Studies have made from various viewpoints, such as climate, characteristis of water and soil, labors, dietary habits, life stresses, blood groups, and living standards, to elucidate this regional difference. However, the correlation between regional differences in mortality from apoplexy and the foregoing factors are not more definite than the correlation between mortality and the habitual salt intake which we reported.6,7) From the data of the Nutrition Survey of Farmers made in 1958 by the Ministry of Agriculture and Forestry8) we calculated and classified by prefecture the correlation between a farmer's average intake of each nutritive element per day and mortality from apoplexy in the middle age(30 to 59 years). The correlation coefficients between mortality and intake of salt and fat, respectively, were +0.6572 and +0.4549 and were significant at less than the 1% level of significance. The larger the intake of salt or fat, the higher was the mortality. No significant correlation was noted between the mortality and the intake of calories, protein, calcium, vitamin A, vitamin B1, vitamin B2 or vitamin C. With regard to the types food, significant correlations at less than the 1% level significance were observed between mortality and pulses, seasonings, other vegetables and pickles, and the total food intake. The larger the intake, the higher was the mortality. In order to investigate the relationship between mortality and items of food intake, the author examined the salt intake from the data of the Nutrition Survey of Farmers. The correlation with the mortality was investigated for salt in seasonings, miso, other vegetables and pickles, soy sauce, other foods, and total salt. It was significant at less than the 1% level of siginificance for salt in miso(+0.7944), total salt(+0.6572), and salt in vegitables and pickles(+0.5282) and not significant in the others.
Salt intake in Japan
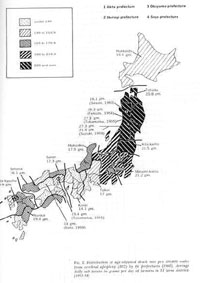
The salt intake of the Japanese seems to be much larger than that of other nations, especially in the northeastern district, an extremely excessive aount of salt is considerd to be taken. According to the Nutrition Survey of Farmers, adult farmer of the northestern district takes 27 gm. a day, where one of the Kinki district takes 17 gm.9) Average salt intake of farmers per capita per day from 1953-58 in 11 farm districts is shown in figure 2.
Fukuda10) measured the excreation of chloride per day in twenty-four-hour urine specimens of 293 farmers in the Akita prefecture and found 26.3 gm. of salt per day on the average, with a maximum of 50 gm. Takamatsu11) reported that the salt excretion examined among 65 farmers in Akita prefecture was 27.3 gm. on the average, with a maximum of 61.4 gm.;measaured among 59 farmers of the Okayama prefecture, it was only 15.4 gm. on the average, with a maximum of 25.9 gm. Suzuki and associates12) observed salt excreation of 27.3 gm. on the average, with a maximum of 41.4 gm. in examination of 56 male farmers in the Yamagata prefecture, and 21.5 gm. on the average, with a maximum of 30.6 gm. for 40 female farmers in the same prefecture. Dahl13)observed 14 gm. of salt excreation among inhabitants in Hiroshima. We14)collected urine of 38 men and women of middle age at an agricultural village in Akita prefecture for a minimum of ten days and maximum of twenty-two days and measured sodium by flame photometry;we 18.1 gm. of salt a day on the average, with a maximum of 30.4 gm. and minimum of 12 gm.
In the district where salt intake is high, mortality from apoplexy and hypertension is often noted. Fukuda10) reported that the prevalence of hypertension was 30 to 40% in the inhabitants of about 50 years in Akita farm villages, and Takamatsu11) and we, too, observed the same findings. Besides, as stated above, definite correlation is observed between regional differences in salt intake and in mortality from apoplexy. Therefore, it is necessary to investigated why the salt intake of the Japanese is so high and why there should be such differences in salt intake.
The salt intake is related to long-standing eating habits. Japanese people take salt mainly in the form (1)soy sauce, (2)seasoning or table salt, (3)miso, (4)pickles, and (5)other foods. According to the survey, Japanese farmers take 6.5 gm. of salt from soy sauce, 5.83 gm. from seasonings, 5.14 gm. from miso, 2.53 gm. from other vegetables and pickels, and 1.21 gm. from other foods per capita per day, respectively, and the total salt intake is 19.21 gm. on the average.
According to the Standard Tables of Food Consumption in Japan, salt contained in soy sauce was 18 gm. per 100 ml.,but the results showed of our analysis of the materials sold in the northeastern district15) showed 16.8 to 25.2 gm., with an average of 21.4 gm. However, no regional differnces were observed in the salt content of soy sauce among various districts of Japan.
Miso is made from soybean, yeast, and salt, it is classified as commercial miso made in factories and homemade miso. According to the analysis table, "sweet miso" 7% salt and "salty miso" 12%, but miso actually sold in various districts contained a maximum of 15%, a minimum of 4%, and an average 12.1% salt; regional differences were marked. Generally, miso in the northeastern district contained more salt, while that in the southwestern district contained less, and significant correlation was found between regional differences in the amount of salt in miso and that in the mortality from apoplexy.16) As to homemade miso, the ratio of salt to soybeans and yeast differed with districts and homes, and generally the ratio was higher in the northeastern districts than in the southwestern districts.
In the acutal daily life, Japanese people take miso in miso soup at meals, and regional differences were noted in the salt concentration of miso soup.17) Sample of 3,578 kinds of miso soup were collected and analysed from 4 districts: Akita predecture in the northeastern disrict, the Ibaragi prefecture where the mortality from apoplexy was high, the Okayama prefecture where the mortality was low, and the Saga prefecture where it was relatively high. Miso soup contained 1.5% of salt in the Akita prefecture, 1.63% in Ibaragi, 1.44%, in Okayama, and 1.47% in Saga. The average was 1.51%. As to a frequency of miso soup consumption, it was quite different with districts(Fig.3, Table 3).
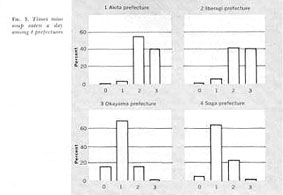
In the Akita prefecture it was served 2.4 times a day; in Ibaragi, 2.4 times; in Okayama, 1 time and in Saga, 1.2 times. Naturally there were great individual variations in salt intake depending upon how many cups were taken at a time. A cup usually contains 150 to 200 ml.
Differences in salt content of pickles were not definitetly shown in the analysis table. According to the values used for calculation in the Nutrition Survey of Farmers, "takuan"(pickled radish) contained 11.9 gm. of salt per 100 gm. , and the other pickles contained 4.12 gm. However, fairly marked regional differences were believed to prevail in the salt content of pickles, since the pickling methods differed with each district. Pickles of the northeastern district seemed to contain more salt. In the Akita prefecture, a habit was noted of eating many pickles with tea between meals.
In addition to miso and pickles, salted fish and preserved food contained much salt. The factors determined the salt intake seem to be the habitual eating habits and the pattern of dietary life of each district. In Japan, the daily salt intake is regurated by the habits of taking miso soup, the number of times a day the soup is taken, the number of cups taken, the habit of eating pickles, and the habit of using soy sauce as a seasoning. Such habits have been produced by the history of Japanese life which is related to the Japanese climate.
On the other hand, when the nutritional requirements were determined in Japan, 13 gm. of salt a day per person was established. The reason given for this amount was that the Japanese take much vegetable food and so consume a large amount of potassium; therefore, the necessary amount of salt was considered larger than that for Europeans or Americans. The Japanese preference and taste also were taken into consideration. This opinion was considered to supported by the experiment and reasoning presented by Bunge18) in 1873. There is a question, however, because recent observations of metabolism of sodium and potassium are different from what Bunge reasoned. The authors also unable to bring out any evidence to prove that the Japanese salt intake was high because the potassium intake was large. As stated above, the salt intake seemed to be determined by eating habits of the district, and there was an observsation to suggest that potassium rather prevented chronic salt intoxication. Meneely and associates 19) demontrated this phenomenon in animal experimants. The authors found that the mortality from apoplexy and the blood pressure levels were lower in the Aomori prefecture where the inhabitants ate more apples containing abundant potassium daily than in the neighboring Akita prefecture; they have been making various investigations on this point.7) Perhaps attention should be paid to the balance between sodium and potassium in food and drink.
It seems necessary to consider the relation of salt intake in daily life to pathogenesis of diseases of the cardiovascular system which is commanding increasing attension with changes in problems of human health. Comparative investigations between salt intake and cardiovascular disease in all the races are necessary, and the relation between excess salt intake and the high ratio of apoplexy and hypertension in Japan, especially in the northeastern district, is worth noting.
Rferences
1. Okinaka, S.:Jap. Circul. J., 23:385-396, 1959.
2. Takahashi, E. et al., Hum. Bio.,29:139-166, 1957.
3. Watanabe, S., J. Geront., 14:299-304, 1959.
4. Itahara, K. et al., Tohoku J. exp. Med., 61;231-244, 1955.
5. Sasaki, N., Jap. J. Pub. Health, 6:496-503, 1959.
6. Sasaki, N. et al., Jap. J. Pub. Health, 7:1137-1143, 1960.
7. Sasaki, N., Jap. Heart J., 3:313-324,1962.
8. Ministry of Agriculture and Forestry:Nutrition Survey of Farmers 1958.
9. Sasaki, N. et al., Sogo Igaku(Meicine), 15:101-106, 1958.
10. Fukuda,T., Chiba Igaku Zashi, 29:490-502, 1954.
11. Takamatsu, M., J. Science of Labour, 31:349-370, 1955.
12. Suzuki,S. et al., Jap. J. of Nutritiom, 17:159-168, 1959.
13. Dahl, L.K., Sodium as etiologic factor in hypertension. The first Hahneman Symposium on Hypertensive Diseases, edited by J.H.Moyer, Phladerphia:W.B.Saunders Co., pp262-268, 1959.
14. Mitsuhashi,T., Hirosaki Med.J.,12:57-74, 1960.
15. Fukushi, S. et al., Hirosaki Med. J.,11,53-56, 1960.
16. Sasaki, N., Medicine and Biology, 38:187-190, 1956.
17. Ukai, H., Hirosaki Med. J., 12:751-765, 1961.
18. Bunge, G., Z.Biol., 9:104-143, 1873.
19. Meneely, G. et al., Ann.intern. Med., 47:263-273, 1957.